Prometheus🔥
Prometheus is an open-source systems monitoring and alerting toolkit. It is often used for monitoring and alerting on the performance and health of servers and other infrastructure components.
Prometheus includes a data model for metrics, a query language for data exploration, and a variety of tools for data collection and alerting. It is typically used in conjunction with other tools, such as Grafana, for visualization and alerting.
Need of Prometheus🤔
In DevOps, it is important to have visibility into the performance of applications and infrastructure to quickly identify and resolve issues. Prometheus provides a way to collect and store metrics from a wide range of sources and to query and analyze this data in real time.
This allows DevOps teams to quickly identify performance bottlenecks and other issues, and to take action to resolve them. Thus, saving us a lot of manual labor through automation.
Use Cases 🧪
Let's take an example, A container ran out of memory which resulted in different containers that were directly connected to it shutting down as well. This leads to the user's being unable to log in to the website/app.
To get the app running again you need to resolve this issue, but how would you know what issue you have to resolve in the first place? You will need to backtrack from the issue and burn the midnight oil to find and fix it.
This is where Prometheus can help us by:
Constantly monitoring all the services
Alerting us if there is a crash
Identifying the problems before they can even happen
Prometheus Architecture🗃️

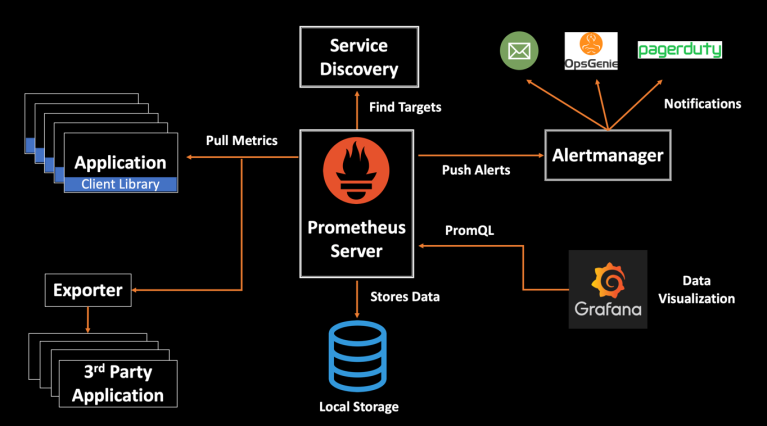
Server: This is the core component of Prometheus that collects, stores, and processes metrics. It scrapes metrics from exporters or via its client libraries and stores the data in a time-series database.
Exporters: These are lightweight programs that run alongside the services being monitored and export metrics in a format that Prometheus can scrape. They are used to collect metrics from services that do not have built-in Prometheus instrumentation.
Alertmanager: This component is responsible for sending alerts based on the metrics collected by Prometheus. It can route alerts based on their severity, and deduplicate and aggregate them before sending notifications to endpoints like email, slack, PagerDuty, etc.
Prometheus also provides a powerful query language for retrieving and analyzing metrics, a web UI for exploring data, and a Grafana integration for visualization.
Additionally, Prometheus is designed for horizontal scalability and can handle a large number of metrics and targets with high availability. It can be deployed in a variety of environments, including on-premise, in the cloud, and Kubernetes clusters.
Advantages and Disadvantages
Advantages | Disadvantages |
|---|---|
Reliable | Limited Storage |
Less Complex | Difficult to scale |
Self-Containing | Limited built-in alerting |
No Extensive Setup needed | Complex querying |
Resources
Setup Prometheus Monitoring on Kubernetes using Helm and Prometheus Operator by Nana
Server Monitoring // Prometheus and Grafana Tutorial by Christian Lempa
Conclusion🔚
In conclusion, Prometheus is a popular and reliable monitoring and alerting tool that is widely used in cloud-native environments. It has a powerful query language, and an alerting system, and it is easy to use. However, it has some limitations like storage, querying, visualization, and alerting. It is recommended to use it in conjunction with other tools to get the best results.
If you loved this blog then be sure to like and Share it with your friends and If you want me to cover a topic related to tech you can always contact me on my Instagram or Twitter.
Check these out as well
